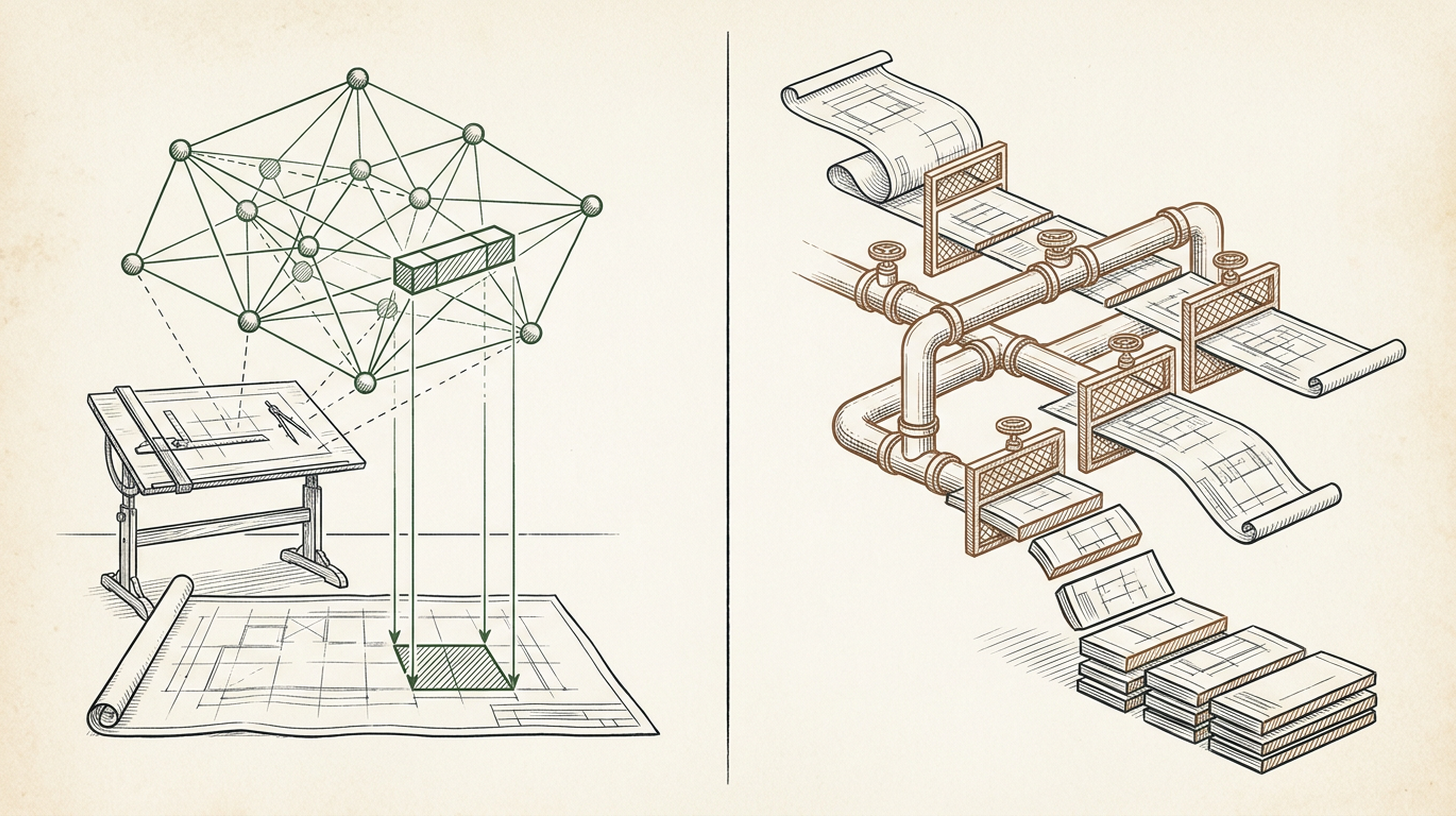
In Antigravity, with the same AGENTS.md rules and the same ast-graph plugin, Gemini 4 Argon used the code graph in 12 of 17 sessions. Claude Opus 5.5 used it in 4 of 17, and ran grep and sed in bash instead.
I built ast-graph (code on GitHub) as part of fixing my own workflow, because I found the agent just scanning thousands of lines of code, being slow, and inefficient. Every couple days I check how it's used across my sessions to find bugs, and on the morning of November 10 I pulled the logs for every session since it went live on November 3 (32 sessions, 5,426 steps). Of those 32, 15 ran only on Opus, 15 ran only on Argon, and 2 switched models partway. Those two count once for each model, which is why the table shows 17 sessions per model.
The plugin's hooks kept the graph index fresh on every edit (hundreds of sync runs in the busiest repos), so the graph was always there to use.
The numbers across 32 sessions
| Metric (Nov 3 to Nov 10) | Claude Opus 5.5 (17 sessions) | Gemini 4 Argon (17 sessions) |
|---|---|---|
| Planner steps analyzed | 3,283 | 2,143 |
Sessions with at least 1 ast-graph query | 4 / 17 (23.5%) | 12 / 17 (70.6%) |
Sessions with more than 1 ast-graph query | 1 / 17 (5.9%) | 11 / 17 (64.7%) |
Canonical ast-graph MCP or plugin CLI calls | 3 | 96 |
Repo local npm run ast:* CLI commands (FreightFloor) | 26 | 11 |
Lazy MCP schema reads (mcp/ast-graph/*.json) | 0 | 38 |
Shell commands using grep, rg, or find | 1,555 | 161 |
Shell commands using sed -n, head, tail, or cat | 1,517 | 50 |
read_file calls (of which unbounded or over 250 lines) | 787 (237, 30.1%) | 1,575 (340, 21.6%) |
Two notes help read the bottom rows. Compound pipelines (grep ... && sed -n ...) count in both shell rows. And Argon's read_file count is higher (1,575 vs. 787) because Argon read files through read_file (50 shell slices), while Opus did most of its file slicing in bash (1,517 sed, head, tail, or cat commands).
In one of my repos, when I pulled the logs, the graph's telemetry table had 25 queries recorded (each batched search term or outlined file counts as one). Two long running Opus sessions (853 combined steps) accounted for 2 of those queries while running 317 grep commands and 343 sed or cat commands.
The first 13 steps of one Argon session accounted for the other 23.
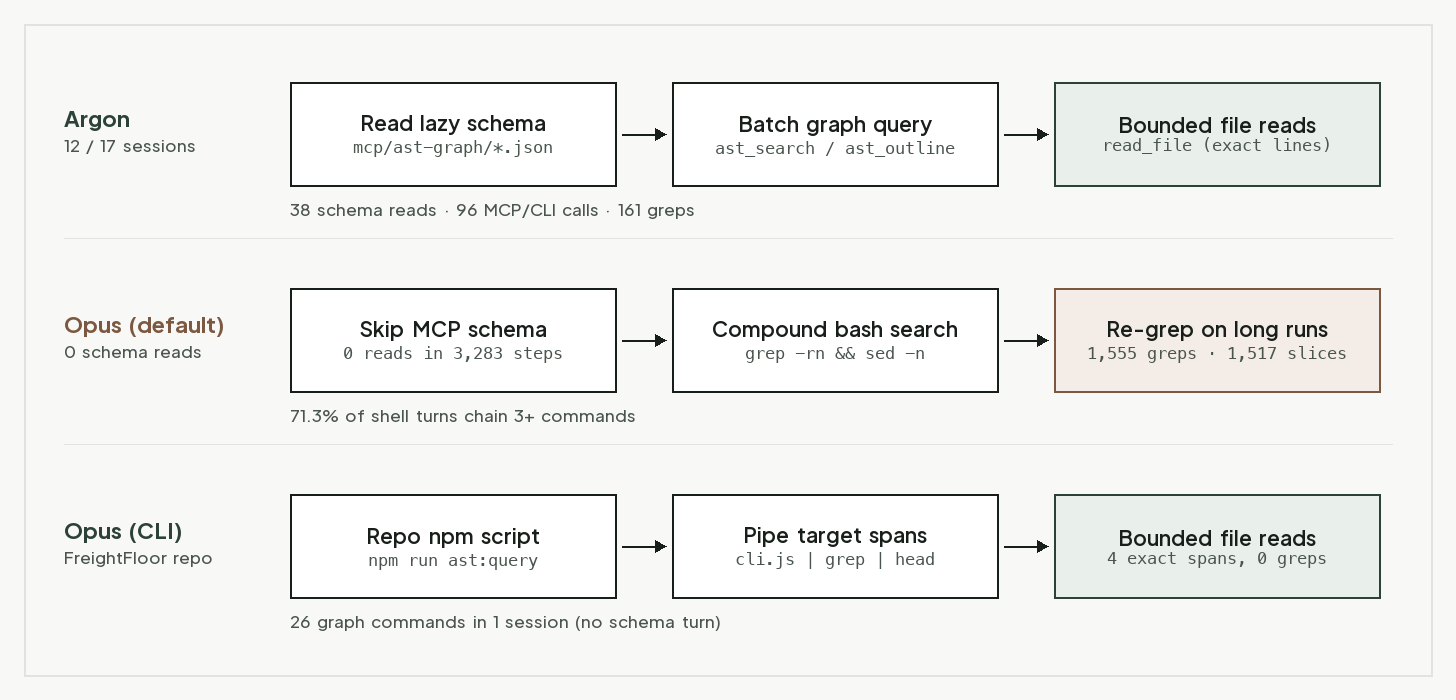
What we saw from Argon: schema first, then bounded reads
With ast-graph available, Argon followed the tool contract step by step.
In that Argon session, it started by reading ast_search.json and ast_assess.json so it knew how to call the tools. On the next turn, it called ast_assess and batched 7 search terms into ast_search. Then it read the ast_outline schema and batched 7 files into one ast_outline call.
After that, it issued up to 6 parallel read_file calls per turn with exact StartLine and EndLine spans, and only reached for rg and grep to find string literals that aren't in the symbol table. Across 17 sessions it ran only 161 shell commands with grep, rg, or find (7.5 per 100 steps).
What we saw from Opus: bash first
Opus went straight to bash.
Antigravity loads MCP tool schemas on demand to keep startup context small. To call ast_outline, the model reads the tool's schema file first, then calls the tool on the next turn.
Across 3,283 steps, Opus read an ast-graph schema file 0 times. AGENTS.md mentioned the plugin CLI path (dist/cli.js) without subcommand examples, and Opus tried it only 3 times across 3 sessions (1 call each).
Instead, it packed several searches into each shell command. Across its 17 sessions, 71.3% of Opus shell commands (1,552 of 2,178) chained three or more commands with && or ; in a single turn.
Here is what that looked like in the logs:
- Early in one session it ran
grep -rn -iE "in_scope|out_of_scope|inScope|outOfScope|scope"across the apps, packages, and docs folders, then a few steps later chainedcat,wc -l apps/api/src/*.ts, andlsinto one bash call. - Instead of
ast_outline, it wrote regex outlines in bash:grep -n "function .Player\|interface .Store\|class .*Store" apps/lobby/src/index.ts. - Instead of calling
read_filewithStartLineandEndLine, it chainedsed -nslices in one command (sed -n 220,226p packages/protocol/src/index.ts; sed -n 36,75p tools/sprites/src/index.ts).
Why does Opus do this?
The logs can't answer that. These weren't matched tasks. Each session was whatever I was working on that day. So they show how Opus searched, not why.
What they do show is what the bash path gets it. One pipeline searches symbol names, string literals, SQL columns, and UI copy in the same turn. No schema to read first. For quick edits, that is genuinely fast. My guess is that Opus leans on bash because that's where it does most of its work in other harnesses. That's a hypothesis. A same task, same repo, same commit run on each model would test it.
The cost shows up on longer sessions. On one project, Opus ran grep against App.tsx in 8 sessions (71 times in one of them) and against db.ts up to 42 times in a session, instead of asking the graph once (1,555 grep commands and 1,517 sed or cat reads across 17 sessions). Blind sed -n line slices cut mid function and miss callers or covering tests, so as context fills up, the agent keeps re-grepping the same big files to reorient itself.
Where Opus used the graph: a one line npm script
There was one exception in the logs: FreightFloor.
In FreightFloor, package.json had one line CLI scripts (ast:query and ast:analyze calling tools/ast-sidecar/dist/cli.js).
Those scripts lived right inside package.json, which Opus already reads at the start of a session. It could call the graph from bash with no schema to look up first, and it called the graph in 26 commands in a single session (8 ast:query lookups and 18 ast:analyze runs to check for circular dependencies). On Step 16, it queried four symbols in one shot (startDriverRun, upsertPlayerStats, dealHand, generateDriverCallsign).
It piped the result through grep and head to keep only the target summaries. On the next step, Opus made 4 bounded read_file calls (engine.ts:5700-5811, engine.ts:764-784, server.ts:825-880, persistence.ts:55-110) across 2 packages, with no round of grep in between.
This lines up with what Armin Ronacher wrote about coding agents. When an agent has a terminal, you can often skip a custom MCP wrapper and give it a script or Makefile target instead.
What the logs caught inside ast-graph
Looking at the Argon and Opus traces side by side also exposed four bugs in my own plugin:
- Batch budget starvation: Argon passed 7 files to
ast_outlinein one batch. Dividing the 3.8 KB budget by 7 left about 540 bytes per file, which cut the 29 symbol outline forauth.tsdown to its header and forced an extra read of the overflow file. - Giant wrapper recommendations: in one repo's
apps/api/src/app.ts,createAppspans lines 46 to 3355.ast_outlinerecommendedStartLine=46, EndLine=3355, violating our own 250 line rule (and inflating Argon's over 250 lineread_filecount in the table). - Ranking noise: CSS rules (
StylesheetSectioninstyles.css) and HTML mockups (docs/planning/mockup-v4.html) outranked real TypeScript functions inapps/andpackages/. - Missing inline signatures:
rules/AGENTS.mdnamed the tools (ast_outline,ast_search,ast_symbol), but omitted the exactcall_mcp_toolJSON keys and CLI subcommands. Opus skipped them rather than paying the schema read turn.
We patched all four on November 10.
Multi file outlines now cap at 30 symbols per file so 7 file batches keep their spans inline. When a wrapper spans over 250 lines, ast_outline points to the first bounded inner function instead. Real code in src/, apps/, and packages/ now ranks ahead of CSS, docs, and mockups. And AGENTS.md puts the exact call_mcp_tool JSON and one line CLI commands inline, while explicitly banning sed -n file slicing.
What changed after the fix
In the Opus sessions since the fix (9 sessions, about 940 steps), Opus called the graph in 4 sessions, 9 calls in total. It still read the schema 0 times. It didn't need to. The inline call syntax in AGENTS.md covered it.
That's about 1.0 graph call per 100 steps, up from 0.1 before the fix outside FreightFloor (Argon sat at 4.5 per 100 steps).
But Opus still searches primarily with bash. It ran 39 grep commands per 100 steps (47 before the fix) and 43 sed or cat commands (46 before). My second laptop shows the same shape: graph calls in 3 of its first 4 Opus sessions, with grep and sed about where they were.
The inline syntax got Opus to try the graph. Bash is still where it does its searching.
What I'm taking from this
Models have different default habits, even in the same harness under the same rules. Argon paid the schema read turn and followed the MCP contract. Opus stayed in bash.
Removing tool friction helped, up to a point. Putting one line CLI and MCP call syntax in AGENTS.md lifted Opus 10x off zero (0.1 to 1.0 calls per 100 steps). Putting ast:query and ast:analyze inside package.json worked even better because package.json is already part of how Opus explores a repo. Even so, a rule in AGENTS.md didn't stop Opus from running grep and sed 40 times per 100 steps. If a check needs to run every time across models, wire it into repo scripts, hooks, or CI. Prompt rules alone won't override how a model likes to work.
The other lesson is to check the session logs on both sides. Without pulling transcripts, I wouldn't have seen Opus skipping lazy MCP schemas, and I wouldn't have caught ast-graph clipping Argon's 7 file batches or recommending a 3,300 line wrapper read. A model following your rules doesn't mean your tool is returning good output.
Have you seen Claude and Gemini behave differently under the same rules? Let me know in the comments!